Common Starling
Sturnus vulgaris
ABR description
The following is extracted from the Annual Bird Report for the twelve months to June 2017.
Very common, breeding resident
An introduced species that is virtually absent from the wet forests but otherwise common throughout the region.
General: This year more birds were counted for this species than for any other, 99064 up on 95505 last year. 3167 records the same as 3168 records last year, from 154 grids up on 144 grids last year. 147 WOO records down from 163 last year. Abundance is down 14% on last year but up 50% on the 30YA. The reporting rate is down 17% on last year, and down 22% on the 30YA. Max 3200/13 May Gordon GrJ17 (CaR3), mean 32, median 6. Records generally distributed evenly throughout the year with slightly more in spring 31%. Breeding: 117 records up on 103 records last year: earliest, ih/31 Jul Norwood Park Crematorium (GrB1); latest, cf/17 Jan JWNR GrL14 (HoS1).
GBS: 573 records down on 614 records last year from 44 sites up on 42 sites last year. Abundance is up 7% on last year but down 67% on the 30YA. The reporting rate is up 6% on last year and down 56% on the 30YA. Mean 8.7, median 4 with max 240/1wk May Bonner GrL10 (GrB1). Breeding, 11 records, the same as last year: earliest, nb/2wk Sep Curtin (AjR1); latest, dy/4wk Dec Curtin (AjR1).
Abundance
Abundance is the average number of birds of that species per survey. Where the species was observed (presence recorded) but the number of birds seen was not recorded, this is treated as a count of zero.
Abundance by year
This chart shows the abundance of Common Starling between 1982 and 2017. 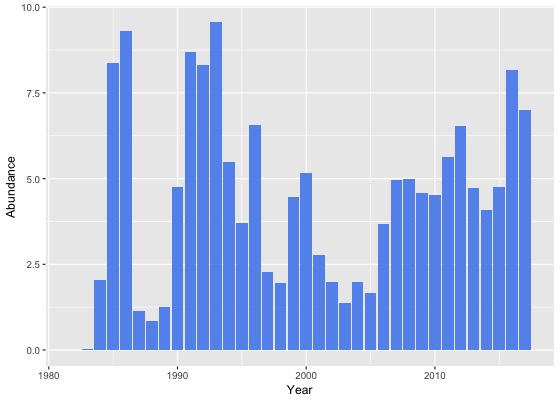
Abundance by month
This chart shows the monthly abundance of Common Starling. The blue lines show the abundance for the twelve months to June 2017 and the bars show the average abundance for the period 1982 to 2017. 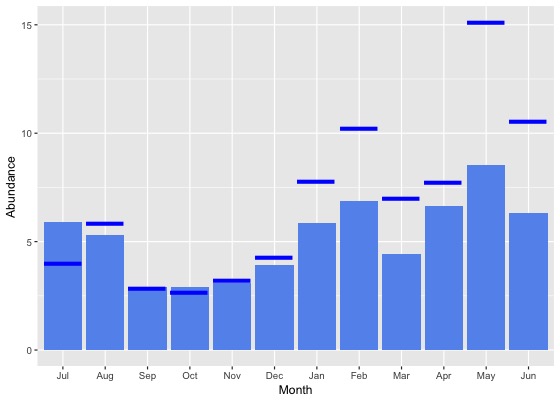
Abundance by season
This chart shows the seasonal abundance of Common Starling. The blue lines show the seasonal abundance for the twelve months to June 2017 and the bars show the average seasonal abundance for the period 1982 to 2017. 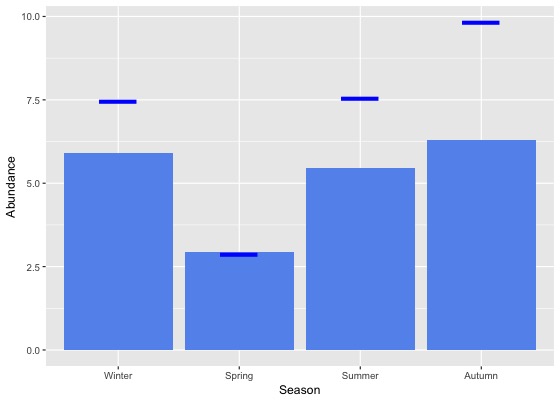
Abundance data
| Month | Season | ||||||||||||||||||
|---|---|---|---|---|---|---|---|---|---|---|---|---|---|---|---|---|---|---|---|
| Period | Jul | Aug | Sep | Oct | Nov | Dec | Jan | Feb | Mar | Apr | May | Jun | Winter | Spring | Summer | Autumn | All | ||
| All years | |||||||||||||||||||
| All | 5.9 | 5.3 | 2.9 | 2.9 | 3.1 | 3.9 | 5.8 | 6.9 | 4.4 | 6.6 | 8.5 | 6.3 | 5.9 | 2.9 | 5.5 | 6.3 | 5.0 | ||
| Previous years | |||||||||||||||||||
| All previous years | 6.2 | 5.2 | 2.9 | 2.9 | 3.1 | 3.9 | 5.5 | 6.2 | 4.0 | 6.4 | 7.0 | 5.5 | 5.6 | 3.0 | 5.1 | 5.6 | 4.7 | ||
| Previous 30 years | 6.2 | 5.0 | 2.9 | 2.9 | 3.1 | 3.8 | 5.5 | 6.1 | 3.9 | 6.4 | 7.0 | 5.6 | 5.6 | 3.0 | 5.1 | 5.6 | 4.7 | ||
| Previous 20 years | 6.8 | 5.6 | 3.1 | 2.9 | 3.2 | 3.5 | 5.9 | 6.6 | 3.9 | 6.7 | 7.5 | 6.1 | 6.1 | 3.0 | 5.2 | 5.8 | 4.9 | ||
| 10 year groups | |||||||||||||||||||
| [2007,2017) | 9.0 | 6.6 | 3.5 | 3.0 | 3.7 | 4.1 | 6.7 | 7.9 | 4.6 | 7.9 | 9.1 | 7.5 | 7.6 | 3.3 | 6.2 | 6.9 | 5.8 | ||
| [1997,2007) | 3.0 | 3.4 | 2.1 | 2.6 | 2.3 | 2.3 | 3.3 | 3.1 | 2.5 | 3.5 | 3.9 | 3.0 | 3.1 | 2.3 | 2.8 | 3.2 | 2.8 | ||
| [1987,1997) | 4.2 | 2.9 | 2.2 | 2.6 | 2.8 | 5.2 | 3.1 | 4.1 | 4.1 | 5.2 | 5.1 | 3.0 | 3.4 | 2.6 | 4.2 | 4.8 | 3.6 | ||
| 5 year groups | |||||||||||||||||||
| [2012,2017) | 9.8 | 7.2 | 3.5 | 2.8 | 3.4 | 4.5 | 7.0 | 8.3 | 4.8 | 9.2 | 8.9 | 7.1 | 7.9 | 3.2 | 6.6 | 7.4 | 6.1 | ||
| [2007,2012) | 6.6 | 4.8 | 3.6 | 3.5 | 4.3 | 3.2 | 5.7 | 6.2 | 4.1 | 4.7 | 9.4 | 8.3 | 7.1 | 3.7 | 4.7 | 5.5 | 5.0 | ||
| [2002,2007) | 2.9 | 2.8 | 1.6 | 2.1 | 1.5 | 1.3 | 2.4 | 1.9 | 2.0 | 3.6 | 3.7 | 1.4 | 2.3 | 1.7 | 1.8 | 2.9 | 2.2 | ||
| [1997,2002) | 3.3 | 4.2 | 2.8 | 3.4 | 3.1 | 3.6 | 4.2 | 4.2 | 3.3 | 3.3 | 4.1 | 5.1 | 4.3 | 3.1 | 4.0 | 3.5 | 3.7 | ||
| [1992,1997) | 10.6 | 5.1 | 4.5 | 4.5 | 5.7 | 13.0 | 5.7 | 5.3 | 4.4 | 7.5 | 8.6 | 3.9 | 6.2 | 4.9 | 8.0 | 6.7 | 6.4 | ||
| [1987,1992) | 1.3 | 1.7 | 1.1 | 1.6 | 1.3 | 1.8 | 1.7 | 3.6 | 3.9 | 3.9 | 3.2 | 2.5 | 1.8 | 1.4 | 2.4 | 3.7 | 2.3 | ||
| Year | |||||||||||||||||||
| 2017 | 4.0 | 5.8 | 2.8 | 2.7 | 3.2 | 4.3 | 7.8 | 10.2 | 7.0 | 7.7 | 15.1 | 10.6 | 7.5 | 2.9 | 7.6 | 9.8 | 7.0 | ||
| 2016 | 5.3 | 4.6 | 3.9 | 2.6 | 4.7 | 7.3 | 13.3 | 10.2 | 5.1 | 17.4 | 12.9 | 8.2 | 6.0 | 3.6 | 10.5 | 11.7 | 8.2 | ||
| 2015 | 8.9 | 6.9 | 4.1 | 2.9 | 2.1 | 3.9 | 4.5 | 5.9 | 3.7 | 4.3 | 6.5 | 6.5 | 7.3 | 3.1 | 4.8 | 4.7 | 4.7 | ||
| 2014 | 3.7 | 5.1 | 1.5 | 2.3 | 3.2 | 3.4 | 3.8 | 9.7 | 5.3 | 2.6 | 6.3 | 3.3 | 3.9 | 2.3 | 5.5 | 4.6 | 4.1 | ||
| 2013 | 19.7 | 5.7 | 3.9 | 2.9 | 3.8 | 1.8 | 4.2 | 4.2 | 4.7 | 4.4 | 7.5 | 4.7 | 9.6 | 3.5 | 3.2 | 5.1 | 4.7 | ||
| 2012 | 18.5 | 19.0 | 3.0 | 3.0 | 2.8 | 4.6 | 4.0 | 10.8 | 5.0 | 5.5 | 3.8 | 12.2 | 16.2 | 3.0 | 5.4 | 4.9 | 6.5 | ||
| 2011 | 14.2 | 4.4 | 5.1 | 5.2 | 4.0 | 2.2 | 4.2 | 2.3 | 2.8 | 4.3 | 8.2 | 13.4 | 11.7 | 5.0 | 3.0 | 5.0 | 5.6 | ||
| 2010 | 6.1 | 4.5 | 3.8 | 4.6 | 3.9 | 4.9 | 4.3 | 7.0 | 2.5 | 4.8 | 7.7 | 4.5 | 4.8 | 4.2 | 5.0 | 4.3 | 4.5 | ||
| 2009 | 3.0 | 4.9 | 3.6 | 3.3 | 5.6 | 2.6 | 5.5 | 4.6 | 9.2 | 5.5 | 6.5 | 3.3 | 3.5 | 3.9 | 4.0 | 7.1 | 4.6 | ||
| 2008 | 1.5 | 4.0 | 3.8 | 2.2 | 5.2 | 2.7 | 9.0 | 10.5 | 3.5 | 2.4 | 20.0 | 11.4 | 6.6 | 3.1 | 6.3 | 5.9 | 5.0 | ||
| 2007 | 10.6 | 6.1 | 1.6 | 2.1 | 2.0 | 3.5 | 7.3 | 10.6 | 3.3 | 7.5 | 7.1 | 7.1 | 7.5 | 1.9 | 6.1 | 5.7 | 5.0 | ||
| 2006 | 3.3 | 1.3 | 2.1 | 2.5 | 3.5 | 2.2 | 5.8 | 4.4 | 3.1 | 10.0 | 6.4 | 2.0 | 2.2 | 2.6 | 4.1 | 5.7 | 3.7 | ||
| 2005 | 1.5 | 2.4 | 1.2 | 3.6 | 1.1 | 1.1 | 1.3 | 1.5 | 2.0 | 1.3 | 2.1 | 1.4 | 1.6 | 1.9 | 1.2 | 1.8 | 1.7 | ||
| 2004 | 2.9 | 1.1 | 0.8 | 1.0 | 0.4 | 1.0 | 1.2 | 1.8 | 0.6 | 4.7 | 9.4 | 1.6 | 2.0 | 0.7 | 1.2 | 4.1 | 2.0 | ||
| 2003 | 2.1 | 3.7 | 1.1 | 1.2 | 1.3 | 1.1 | 1.2 | 1.2 | 0.7 | 1.7 | 0.6 | 1.4 | 2.4 | 1.2 | 1.2 | 1.0 | 1.4 | ||
| 2002 | 4.1 | 5.7 | 2.6 | 1.8 | 1.4 | 1.4 | 2.0 | 0.9 | 2.7 | 0.6 | 1.2 | 0.7 | 3.2 | 1.9 | 1.4 | 1.7 | 2.0 | ||
| 2001 | 1.0 | 2.9 | 3.1 | 1.9 | 5.2 | 3.2 | 1.5 | 1.1 | 4.9 | 3.2 | 0.9 | 2.9 | 2.2 | 3.2 | 2.1 | 3.4 | 2.8 | ||
| 2000 | 6.1 | 5.9 | 2.9 | 5.4 | 3.9 | 2.8 | 6.5 | 5.5 | 3.1 | 3.2 | 8.5 | 12.4 | 8.6 | 4.1 | 4.8 | 4.1 | 5.2 | ||
| 1999 | 10.3 | 3.6 | 3.0 | 3.4 | 2.0 | 8.9 | 5.9 | 5.3 | 2.3 | 4.9 | 5.0 | 3.9 | 4.4 | 2.8 | 6.8 | 4.1 | 4.5 | ||
| 1998 | 3.5 | 5.4 | 3.0 | 2.6 | 1.0 | 0.8 | 1.4 | 4.0 | 0.9 | 1.2 | 1.1 | 0.5 | 2.7 | 2.2 | 1.7 | 1.0 | 2.0 | ||
| 1997 | 2.2 | 3.2 | 1.0 | 3.1 | 1.8 | 1.6 | 3.4 | 7.3 | 1.2 | 1.5 | 3.9 | 0.5 | 1.9 | 1.8 | 3.5 | 2.0 | 2.3 | ||
| 1996 | 3.1 | 5.3 | 2.1 | 3.6 | 2.1 | 31.7 | 4.3 | 1.0 | 1.8 | 6.2 | 9.8 | 7.0 | 5.3 | 2.7 | 12.8 | 5.1 | 6.6 | ||
| 1995 | 5.3 | 2.1 | 1.3 | 2.9 | 2.9 | 2.4 | 5.6 | 2.4 | 7.3 | 5.0 | 6.2 | 1.6 | 2.9 | 2.4 | 3.8 | 6.1 | 3.7 | ||
| 1994 | 19.0 | 7.0 | 7.8 | 5.9 | 6.2 | 7.5 | 4.3 | 3.0 | 0.9 | 3.0 | 4.8 | 3.7 | 8.4 | 6.5 | 4.7 | 2.9 | 5.5 | ||
| 1993 | 6.7 | 8.4 | 8.6 | 8.9 | 17.3 | 7.2 | 13.0 | 12.2 | 10.2 | 13.5 | 8.2 | 2.2 | 5.8 | 11.5 | 10.7 | 10.4 | 9.6 | ||
| 1992 | 22.1 | 4.8 | 4.9 | 3.4 | 4.3 | 6.2 | 3.5 | 16.7 | 1.7 | 17.9 | 14.5 | 5.5 | 11.3 | 4.2 | 7.9 | 11.1 | 8.3 | ||
| 1991 | 3.3 | 4.6 | 5.5 | 4.1 | 8.6 | 7.4 | 11.8 | 9.8 | 16.1 | 24.9 | 17.2 | 3.8 | 3.8 | 6.0 | 9.4 | 19.3 | 8.7 | ||
| 1990 | 1.8 | 0.6 | 0.3 | 2.7 | 0.3 | 1.7 | 2.7 | 11.2 | 18.3 | 10.4 | 10.7 | 6.2 | 2.1 | 1.1 | 5.2 | 13.3 | 4.7 | ||
| 1989 | 0.5 | 1.9 | 0.8 | 1.2 | 0.5 | 1.1 | 0.4 | 1.3 | 0.4 | 1.4 | 1.7 | 3.9 | 2.0 | 0.9 | 1.0 | 1.1 | 1.2 | ||
| 1988 | 0.4 | 1.1 | 0.6 | 1.0 | 0.5 | 0.7 | 0.4 | 2.1 | 0.4 | 1.5 | 0.6 | 1.3 | 0.9 | 0.7 | 1.0 | 0.8 | 0.9 | ||
| 1987 | 5.5 | 7.0 | 0.5 | 1.2 | 0.8 | 1.8 | 1.1 | 3.1 | 0.4 | 0.6 | 0.5 | 0.8 | 1.4 | 0.8 | 2.1 | 0.5 | 1.1 | ||
| 1986 | 0.1 | 30.2 | 1.4 | 5.7 | 1.9 | 23.3 | 0.1 | 14.0 | 8.0 | 14.4 | 3.4 | 5.4 | 13.5 | 2.7 | 14.0 | 9.7 | 9.3 | ||
| 1985 | 10.8 | 13.3 | 1.7 | 7.1 | 1.7 | 9.3 | 14.0 | 15.2 | 33.6 | 6.9 | 20.2 | 9.1 | 11.1 | 4.1 | 10.9 | 17.6 | 8.4 | ||
| 1984 | 0.0 | 0.0 | 0.0 | 0.0 | 0.0 | 0.0 | 5.4 | 0.0 | 0.4 | 2.4 | 7.0 | 0.4 | 0.3 | 0.0 | 2.1 | 3.4 | 2.0 | ||
| 1983 | 0.0 | 0.0 | 0.0 | 0.1 | 0.1 | 0.2 | 0.0 | 0.0 | 0.0 | - | 0.0 | 0.0 | 0.0 | 0.1 | 0.1 | 0.0 | 0.0 | ||
| 1982 | - | 0.0 | - | 0.0 | 0.0 | 0.0 | - | 0.0 | - | 0.0 | - | 0.0 | 0.0 | 0.0 | 0.0 | 0.0 | 0.0 | ||
Reporting rates
Reporting rate is the proportion of all surveys in which the species was present.
Reporting rate by year
This chart shows the reporting rate of Common Starling each year between 1982 and 2017. 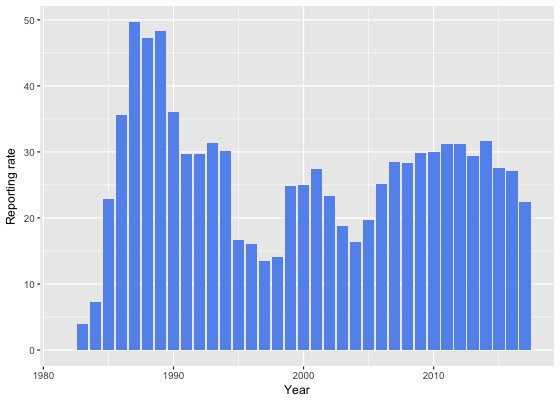
Reporting rate by month
This chart shows the reporting rate by month of Common Starling. The blue lines show the reporting rate for the twelve months to June 2017 and the bars show the average reporting rate for the period 1982 to 2017. 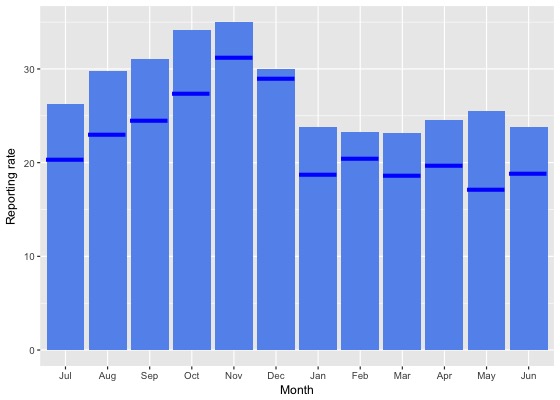
Reporting rate by season
This chart shows the seasonal reporting rate of Common Starling. The blue lines show the seasonal reporting rate for the twelve months to June 2017 and the bars show the average seasonal reporting rate for the period 1982 to 2017. 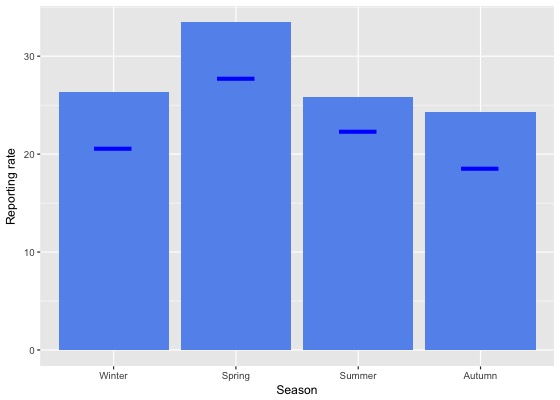
Reporting rate data
| Month | Season | ||||||||||||||||||
|---|---|---|---|---|---|---|---|---|---|---|---|---|---|---|---|---|---|---|---|
| Period | Jul | Aug | Sep | Oct | Nov | Dec | Jan | Feb | Mar | Apr | May | Jun | Winter | Spring | Summer | Autumn | All | ||
| All years | |||||||||||||||||||
| All | 26.3 | 29.8 | 31.1 | 34.2 | 35.0 | 30.0 | 23.8 | 23.2 | 23.2 | 24.5 | 25.5 | 23.8 | 26.3 | 33.4 | 25.8 | 24.3 | 27.8 | ||
| Previous years | |||||||||||||||||||
| All previous years | 27.2 | 31.1 | 32.0 | 35.1 | 35.6 | 30.1 | 24.7 | 23.8 | 24.0 | 25.3 | 27.5 | 24.8 | 27.4 | 34.3 | 26.4 | 25.4 | 28.7 | ||
| Previous 30 years | 27.4 | 31.3 | 32.2 | 35.3 | 35.7 | 30.2 | 24.8 | 23.8 | 24.1 | 25.2 | 27.6 | 24.9 | 27.6 | 34.5 | 26.5 | 25.4 | 28.8 | ||
| Previous 20 years | 24.4 | 29.7 | 30.5 | 33.8 | 33.4 | 28.6 | 23.3 | 21.7 | 22.8 | 22.9 | 25.1 | 22.9 | 25.3 | 32.7 | 24.8 | 23.4 | 26.9 | ||
| 10 year groups | |||||||||||||||||||
| [2007,2017) | 27.2 | 32.0 | 32.5 | 34.5 | 38.1 | 31.1 | 24.7 | 24.1 | 24.5 | 23.7 | 28.6 | 25.3 | 27.8 | 34.7 | 26.7 | 25.2 | 28.9 | ||
| [1997,2007) | 19.5 | 24.8 | 26.6 | 31.5 | 23.9 | 23.8 | 18.6 | 15.7 | 18.9 | 20.8 | 16.6 | 17.8 | 20.2 | 27.5 | 20.1 | 19.0 | 22.0 | ||
| [1987,1997) | 37.9 | 36.1 | 40.9 | 43.8 | 43.6 | 39.6 | 33.2 | 33.7 | 31.6 | 36.8 | 37.2 | 35.1 | 36.3 | 42.9 | 35.6 | 35.2 | 37.8 | ||
| 5 year groups | |||||||||||||||||||
| [2012,2017) | 28.6 | 33.2 | 31.3 | 34.6 | 39.0 | 31.0 | 24.0 | 23.5 | 23.9 | 24.3 | 27.8 | 24.4 | 28.4 | 34.7 | 26.0 | 25.0 | 28.7 | ||
| [2007,2012) | 23.4 | 27.4 | 35.2 | 34.3 | 35.6 | 31.1 | 27.3 | 26.4 | 26.4 | 22.2 | 30.7 | 26.9 | 26.2 | 34.8 | 28.8 | 25.7 | 29.6 | ||
| [2002,2007) | 19.7 | 21.6 | 25.0 | 29.9 | 20.8 | 22.7 | 18.3 | 15.2 | 19.3 | 20.1 | 14.9 | 15.9 | 18.6 | 25.6 | 19.5 | 18.5 | 20.8 | ||
| [1997,2002) | 19.3 | 28.5 | 28.5 | 34.0 | 27.6 | 25.1 | 19.1 | 16.2 | 18.4 | 21.7 | 18.6 | 20.4 | 22.5 | 29.9 | 20.7 | 19.6 | 23.4 | ||
| [1992,1997) | 24.9 | 22.5 | 26.2 | 26.1 | 40.4 | 26.7 | 18.7 | 17.2 | 16.4 | 20.3 | 24.2 | 15.8 | 20.8 | 31.1 | 21.0 | 20.1 | 23.7 | ||
| [1987,1992) | 43.7 | 43.6 | 47.8 | 53.4 | 45.1 | 45.3 | 41.3 | 40.0 | 40.7 | 46.2 | 43.9 | 46.1 | 44.4 | 48.8 | 42.3 | 43.6 | 45.0 | ||
| Year | |||||||||||||||||||
| 2017 | 20.3 | 23.0 | 24.5 | 27.4 | 31.3 | 29.0 | 18.7 | 20.5 | 18.7 | 19.8 | 17.2 | 18.9 | 20.6 | 27.7 | 22.4 | 18.5 | 22.4 | ||
| 2016 | 25.9 | 28.2 | 29.1 | 32.7 | 40.3 | 28.0 | 21.3 | 22.9 | 24.2 | 25.2 | 25.2 | 24.2 | 26.2 | 33.5 | 23.7 | 24.8 | 27.1 | ||
| 2015 | 28.7 | 35.6 | 30.9 | 34.9 | 32.4 | 31.4 | 20.3 | 23.1 | 21.5 | 20.1 | 30.7 | 25.3 | 29.0 | 33.0 | 24.5 | 23.5 | 27.5 | ||
| 2014 | 27.3 | 32.8 | 30.6 | 39.2 | 39.3 | 30.4 | 33.1 | 29.5 | 30.1 | 26.3 | 28.3 | 26.1 | 28.4 | 36.7 | 31.5 | 28.4 | 31.6 | ||
| 2013 | 27.3 | 31.7 | 35.3 | 30.6 | 45.4 | 32.1 | 26.8 | 20.5 | 22.4 | 27.7 | 25.9 | 22.7 | 26.9 | 36.0 | 27.4 | 25.0 | 29.3 | ||
| 2012 | 37.2 | 47.2 | 33.7 | 36.6 | 40.7 | 36.4 | 21.6 | 21.5 | 21.1 | 24.0 | 32.6 | 22.3 | 34.3 | 36.8 | 26.5 | 24.7 | 31.2 | ||
| 2011 | 26.8 | 30.4 | 37.2 | 39.4 | 35.2 | 32.7 | 31.7 | 27.9 | 27.5 | 20.4 | 30.9 | 29.1 | 28.9 | 38.0 | 31.1 | 26.0 | 31.2 | ||
| 2010 | 30.2 | 21.1 | 33.3 | 37.5 | 28.2 | 33.1 | 29.0 | 32.9 | 29.9 | 21.3 | 27.5 | 24.0 | 24.6 | 34.3 | 31.6 | 26.1 | 30.0 | ||
| 2009 | 23.0 | 41.7 | 39.5 | 33.9 | 29.0 | 28.6 | 24.0 | 20.0 | 24.2 | 25.4 | 29.0 | 28.8 | 29.8 | 34.3 | 24.8 | 25.8 | 29.8 | ||
| 2008 | 17.9 | 27.8 | 35.6 | 30.4 | 44.3 | 31.1 | 31.0 | 23.1 | 23.7 | 17.1 | 29.7 | 27.6 | 24.7 | 33.9 | 29.2 | 21.3 | 28.3 | ||
| 2007 | 20.9 | 17.6 | 29.9 | 31.0 | 48.0 | 29.2 | 20.5 | 28.7 | 25.1 | 29.5 | 35.8 | 25.1 | 22.7 | 33.7 | 25.8 | 29.1 | 28.5 | ||
| 2006 | 18.4 | 25.2 | 26.4 | 29.4 | 19.6 | 26.3 | 28.7 | 25.9 | 24.6 | 25.3 | 22.5 | 23.4 | 22.3 | 26.5 | 27.0 | 24.4 | 25.1 | ||
| 2005 | 11.8 | 23.4 | 23.0 | 26.5 | 19.3 | 19.5 | 17.7 | 17.4 | 22.1 | 18.6 | 15.9 | 18.3 | 17.6 | 23.2 | 18.6 | 19.0 | 19.7 | ||
| 2004 | 19.0 | 15.1 | 17.3 | 30.2 | 14.5 | 21.7 | 12.7 | 12.1 | 9.8 | 19.2 | 8.7 | 8.6 | 15.0 | 20.5 | 16.6 | 13.2 | 16.4 | ||
| 2003 | 15.4 | 21.6 | 28.0 | 26.9 | 19.7 | 21.2 | 14.1 | 12.1 | 13.9 | 22.6 | 10.9 | 10.6 | 15.6 | 24.9 | 16.5 | 16.5 | 18.8 | ||
| 2002 | 30.9 | 25.4 | 30.3 | 35.6 | 29.5 | 25.1 | 16.4 | 9.9 | 21.8 | 13.7 | 14.1 | 12.9 | 22.5 | 32.0 | 19.4 | 17.5 | 23.3 | ||
| 2001 | 19.1 | 33.7 | 33.2 | 38.2 | 43.8 | 38.4 | 19.0 | 15.5 | 20.8 | 27.8 | 13.9 | 21.7 | 24.1 | 37.3 | 26.0 | 21.1 | 27.4 | ||
| 2000 | 28.6 | 35.9 | 33.0 | 41.0 | 33.3 | 17.4 | 16.1 | 16.7 | 18.0 | 21.7 | 19.1 | 25.8 | 29.9 | 35.9 | 16.8 | 19.6 | 25.1 | ||
| 1999 | 20.6 | 21.6 | 29.3 | 30.8 | 23.4 | 34.4 | 25.5 | 18.6 | 21.1 | 23.7 | 20.5 | 24.8 | 23.5 | 27.9 | 26.5 | 21.8 | 24.9 | ||
| 1998 | 10.8 | 18.9 | 19.5 | 20.7 | 13.3 | 9.4 | 17.6 | 7.5 | 7.5 | 15.4 | 25.9 | 8.0 | 12.1 | 17.7 | 11.5 | 12.6 | 14.1 | ||
| 1997 | 9.2 | 13.8 | 13.6 | 22.4 | 12.0 | 13.5 | 17.6 | 19.3 | 15.0 | 9.2 | 24.4 | 2.8 | 8.3 | 15.2 | 16.0 | 13.9 | 13.5 | ||
| 1996 | 16.4 | 10.6 | 18.7 | 20.2 | 19.4 | 19.2 | 17.5 | 7.1 | 8.8 | 12.5 | 22.4 | 20.7 | 15.7 | 19.5 | 15.0 | 13.4 | 16.1 | ||
| 1995 | 19.4 | 12.4 | 9.7 | 18.9 | 19.1 | 16.1 | 16.8 | 14.3 | 23.5 | 18.5 | 18.2 | 11.7 | 14.2 | 16.4 | 16.0 | 20.1 | 16.7 | ||
| 1994 | 41.2 | 42.9 | 52.9 | 30.2 | 60.3 | 37.0 | 16.2 | 20.7 | 9.1 | 19.1 | 13.8 | 14.6 | 30.9 | 49.7 | 23.3 | 14.7 | 30.2 | ||
| 1993 | 16.3 | 32.1 | 35.5 | 36.0 | 60.6 | 47.8 | 26.5 | 37.5 | 22.2 | 23.3 | 28.6 | 14.5 | 21.9 | 43.8 | 37.0 | 24.8 | 31.3 | ||
| 1992 | 35.4 | 24.1 | 24.7 | 34.0 | 48.6 | 30.2 | 20.7 | 22.0 | 19.7 | 32.2 | 38.2 | 18.3 | 26.3 | 35.1 | 24.7 | 30.1 | 29.7 | ||
| 1991 | 22.8 | 18.1 | 23.3 | 30.1 | 40.2 | 24.3 | 28.6 | 38.0 | 31.7 | 42.4 | 39.3 | 30.0 | 22.5 | 31.5 | 29.4 | 37.7 | 29.7 | ||
| 1990 | 47.1 | 37.3 | 25.8 | 33.7 | 33.6 | 37.5 | 33.3 | 29.6 | 39.8 | 35.7 | 34.2 | 35.5 | 40.6 | 31.2 | 33.5 | 36.7 | 36.1 | ||
| 1989 | 52.0 | 53.9 | 48.9 | 58.1 | 49.0 | 46.1 | 41.5 | 36.6 | 42.2 | 49.7 | 42.1 | 53.6 | 53.2 | 52.4 | 41.7 | 45.0 | 48.3 | ||
| 1988 | 44.4 | 47.8 | 61.2 | 55.5 | 44.6 | 47.2 | 35.2 | 42.9 | 37.1 | 53.5 | 47.5 | 50.7 | 47.5 | 52.6 | 41.7 | 45.8 | 47.3 | ||
| 1987 | 72.7 | 46.7 | 53.8 | 63.7 | 48.4 | 52.6 | 53.8 | 44.2 | 45.9 | 42.4 | 46.3 | 43.1 | 44.8 | 54.7 | 49.8 | 44.8 | 49.6 | ||
| 1986 | 23.1 | 36.8 | 30.2 | 50.0 | 40.4 | 47.1 | 13.0 | 33.3 | 19.4 | 49.0 | 27.6 | 37.1 | 33.3 | 39.0 | 33.3 | 35.1 | 35.5 | ||
| 1985 | 6.7 | 26.7 | 9.6 | 17.4 | 21.1 | 21.7 | 62.5 | 70.6 | 18.2 | 42.1 | 50.0 | 21.4 | 18.2 | 16.4 | 35.3 | 37.5 | 22.8 | ||
| 1984 | 0.0 | 0.0 | 0.0 | 0.0 | 0.0 | 0.0 | 13.8 | 0.0 | 3.7 | 20.6 | 12.9 | 2.9 | 2.0 | 0.0 | 5.4 | 13.0 | 7.2 | ||
| 1983 | 0.0 | 0.0 | 0.0 | 7.7 | 11.1 | 15.4 | 0.0 | 0.0 | 0.0 | - | 0.0 | 0.0 | 0.0 | 7.4 | 6.7 | 0.0 | 4.0 | ||
| 1982 | - | 0.0 | - | 0.0 | 0.0 | 0.0 | - | 0.0 | - | 0.0 | - | 0.0 | 0.0 | 0.0 | 0.0 | 0.0 | 0.0 | ||
Breeding data
Breeding records by month
Number of breeding records by breeding code and month, 2017 and all years| Breeding code | Jul | Aug | Sep | Oct | Nov | Dec | Jan | Feb | Mar | Apr | May | Jun |
|---|---|---|---|---|---|---|---|---|---|---|---|---|
| 2017 | ||||||||||||
| Breeding (BLA code) | 0 | 0 | 0 | 0 | 0 | 0 | 0 | 0 | 0 | 0 | 0 | 0 |
| Carrying Food | 0 | 1 | 2 | 21 | 13 | 14 | 1 | 0 | 0 | 0 | 0 | 0 |
| Copulating | 0 | 0 | 0 | 0 | 0 | 0 | 0 | 0 | 0 | 0 | 0 | 0 |
| Display | 0 | 0 | 0 | 0 | 1 | 0 | 0 | 0 | 0 | 0 | 0 | 0 |
| Dependent young | 0 | 0 | 0 | 3 | 3 | 4 | 4 | 0 | 0 | 0 | 0 | 0 |
| Faecal sac | 0 | 0 | 0 | 0 | 0 | 0 | 0 | 0 | 0 | 0 | 0 | 0 |
| Inspecting hollow | 1 | 2 | 2 | 4 | 2 | 0 | 0 | 0 | 0 | 0 | 0 | 0 |
| Nest building | 0 | 0 | 3 | 2 | 0 | 0 | 0 | 0 | 0 | 0 | 0 | 0 |
| Nest with eggs | 0 | 0 | 0 | 0 | 0 | 0 | 0 | 0 | 0 | 0 | 0 | 0 |
| Nest with young | 0 | 0 | 0 | 8 | 11 | 2 | 0 | 0 | 0 | 0 | 0 | 0 |
| On/leaving nest | 0 | 0 | 1 | 8 | 1 | 3 | 0 | 0 | 0 | 0 | 0 | 0 |
| All years | ||||||||||||
| Breeding (BLA code) | 0 | 0 | 2 | 8 | 16 | 7 | 3 | 0 | 0 | 0 | 0 | 0 |
| Carrying Food | 0 | 2 | 12 | 179 | 93 | 94 | 3 | 1 | 0 | 1 | 0 | 0 |
| Copulating | 0 | 0 | 1 | 2 | 0 | 0 | 0 | 0 | 0 | 0 | 0 | 1 |
| Display | 0 | 0 | 0 | 1 | 1 | 0 | 0 | 0 | 0 | 0 | 0 | 0 |
| Dependent young | 0 | 0 | 1 | 50 | 62 | 55 | 8 | 2 | 0 | 0 | 0 | 0 |
| Faecal sac | 0 | 0 | 0 | 1 | 0 | 0 | 0 | 0 | 0 | 0 | 0 | 0 |
| Inspecting hollow | 2 | 17 | 36 | 49 | 16 | 29 | 0 | 2 | 1 | 2 | 2 | 2 |
| Nest building | 0 | 6 | 40 | 84 | 34 | 13 | 6 | 0 | 0 | 0 | 0 | 0 |
| Nest with eggs | 0 | 0 | 5 | 5 | 4 | 0 | 0 | 0 | 0 | 0 | 0 | 0 |
| Nest with young | 0 | 0 | 4 | 165 | 118 | 78 | 3 | 0 | 0 | 0 | 0 | 0 |
| On/leaving nest | 0 | 0 | 34 | 76 | 21 | 23 | 1 | 0 | 4 | 0 | 0 | 0 |
Breeding records by year
Average number of breeding records per period by breeding code| Period | Breeding (BLA code) | Carrying Food | Copulating | Display | Dependent young | Faecal sac | Inspecting hollow | Nest building | Nest with eggs | Nest with young | On/leaving nest |
|---|---|---|---|---|---|---|---|---|---|---|---|
| All years | |||||||||||
| All | 1.0 | 10.7 | 0.1 | 0.1 | 4.9 | 0.0 | 4.4 | 5.1 | 0.4 | 10.2 | 4.4 |
| Previous years | |||||||||||
| All previous years | 1.0 | 9.5 | 0.1 | 0.0 | 4.7 | 0.0 | 4.2 | 5.1 | 0.4 | 9.9 | 4.2 |
| Previous 30 years | 1.2 | 11.1 | 0.1 | 0.0 | 5.4 | 0.0 | 4.9 | 5.9 | 0.5 | 11.6 | 4.9 |
| Previous 20 years | 1.8 | 11.9 | 0.2 | 0.0 | 4.2 | 0.0 | 7.0 | 2.0 | 0.1 | 9.1 | 7.2 |
| 10 year groups | |||||||||||
| [2007,2017) | 2.1 | 17.8 | 0.4 | 0.1 | 5.0 | 0.0 | 9.2 | 2.8 | 0.1 | 12.3 | 11.6 |
| [1997,2007) | 1.5 | 6.1 | 0.0 | 0.0 | 3.3 | 0.1 | 4.8 | 1.2 | 0.1 | 5.9 | 2.8 |
| [1987,1997) | 0.0 | 9.4 | 0.0 | 0.0 | 8.0 | 0.0 | 0.7 | 13.6 | 1.2 | 16.5 | 0.2 |
| 5 year groups | |||||||||||
| [2012,2017) | 3.2 | 18.2 | 0.4 | 0.2 | 6.8 | 0.0 | 10.0 | 3.8 | 0.0 | 13.0 | 10.6 |
| [2007,2012) | 1.0 | 17.4 | 0.4 | 0.0 | 3.2 | 0.0 | 8.4 | 1.8 | 0.2 | 11.6 | 12.6 |
| [2002,2007) | 1.0 | 7.2 | 0.0 | 0.0 | 4.0 | 0.2 | 5.8 | 1.0 | 0.2 | 4.2 | 2.4 |
| [1997,2002) | 2.0 | 5.0 | 0.0 | 0.0 | 2.6 | 0.0 | 3.8 | 1.4 | 0.0 | 7.6 | 3.2 |
| [1992,1997) | 0.0 | 2.6 | 0.0 | 0.0 | 0.4 | 0.0 | 1.4 | 0.8 | 0.0 | 2.6 | 0.4 |
| [1987,1992) | 0.0 | 16.2 | 0.0 | 0.0 | 15.6 | 0.0 | 0.0 | 26.4 | 2.4 | 30.4 | 0.0 |
| Year | |||||||||||
| 2017 | 0.0 | 52.0 | 0.0 | 1.0 | 14.0 | 0.0 | 11.0 | 5.0 | 0.0 | 21.0 | 13.0 |
| 2016 | 0.0 | 32.0 | 1.0 | 0.0 | 9.0 | 0.0 | 15.0 | 10.0 | 0.0 | 23.0 | 13.0 |
| 2015 | 0.0 | 11.0 | 0.0 | 0.0 | 10.0 | 0.0 | 11.0 | 3.0 | 0.0 | 21.0 | 6.0 |
| 2014 | 3.0 | 23.0 | 0.0 | 1.0 | 5.0 | 0.0 | 11.0 | 1.0 | 0.0 | 12.0 | 10.0 |
| 2013 | 1.0 | 17.0 | 0.0 | 0.0 | 4.0 | 0.0 | 9.0 | 3.0 | 0.0 | 6.0 | 15.0 |
| 2012 | 12.0 | 8.0 | 1.0 | 0.0 | 6.0 | 0.0 | 4.0 | 2.0 | 0.0 | 3.0 | 9.0 |
| 2011 | 2.0 | 25.0 | 0.0 | 0.0 | 5.0 | 0.0 | 3.0 | 1.0 | 0.0 | 9.0 | 11.0 |
| 2010 | 0.0 | 22.0 | 0.0 | 0.0 | 5.0 | 0.0 | 11.0 | 0.0 | 0.0 | 20.0 | 24.0 |
| 2009 | 1.0 | 17.0 | 0.0 | 0.0 | 3.0 | 0.0 | 14.0 | 5.0 | 0.0 | 16.0 | 14.0 |
| 2008 | 0.0 | 15.0 | 2.0 | 0.0 | 1.0 | 0.0 | 11.0 | 2.0 | 0.0 | 7.0 | 13.0 |
| 2007 | 2.0 | 8.0 | 0.0 | 0.0 | 2.0 | 0.0 | 3.0 | 1.0 | 1.0 | 6.0 | 1.0 |
| 2006 | 2.0 | 12.0 | 0.0 | 0.0 | 10.0 | 1.0 | 9.0 | 1.0 | 1.0 | 4.0 | 4.0 |
| 2005 | 0.0 | 8.0 | 0.0 | 0.0 | 3.0 | 0.0 | 2.0 | 0.0 | 0.0 | 5.0 | 2.0 |
| 2004 | 1.0 | 2.0 | 0.0 | 0.0 | 0.0 | 0.0 | 6.0 | 2.0 | 0.0 | 0.0 | 4.0 |
| 2003 | 0.0 | 1.0 | 0.0 | 0.0 | 5.0 | 0.0 | 6.0 | 0.0 | 0.0 | 3.0 | 0.0 |
| 2002 | 2.0 | 13.0 | 0.0 | 0.0 | 2.0 | 0.0 | 6.0 | 2.0 | 0.0 | 9.0 | 2.0 |
| 2001 | 6.0 | 10.0 | 0.0 | 0.0 | 4.0 | 0.0 | 10.0 | 1.0 | 0.0 | 30.0 | 4.0 |
| 2000 | 1.0 | 5.0 | 0.0 | 0.0 | 4.0 | 0.0 | 3.0 | 3.0 | 0.0 | 3.0 | 3.0 |
| 1999 | 3.0 | 8.0 | 0.0 | 0.0 | 4.0 | 0.0 | 3.0 | 2.0 | 0.0 | 1.0 | 6.0 |
| 1998 | 0.0 | 1.0 | 0.0 | 0.0 | 0.0 | 0.0 | 2.0 | 0.0 | 0.0 | 2.0 | 1.0 |
| 1997 | 0.0 | 1.0 | 0.0 | 0.0 | 1.0 | 0.0 | 1.0 | 1.0 | 0.0 | 2.0 | 2.0 |
| 1996 | 0.0 | 2.0 | 0.0 | 0.0 | 0.0 | 0.0 | 1.0 | 0.0 | 0.0 | 1.0 | 2.0 |
| 1995 | 0.0 | 0.0 | 0.0 | 0.0 | 0.0 | 0.0 | 0.0 | 0.0 | 0.0 | 0.0 | 0.0 |
| 1994 | 0.0 | 4.0 | 0.0 | 0.0 | 1.0 | 0.0 | 4.0 | 1.0 | 0.0 | 2.0 | 0.0 |
| 1993 | 0.0 | 3.0 | 0.0 | 0.0 | 0.0 | 0.0 | 2.0 | 2.0 | 0.0 | 5.0 | 0.0 |
| 1992 | 0.0 | 4.0 | 0.0 | 0.0 | 1.0 | 0.0 | 0.0 | 1.0 | 0.0 | 5.0 | 0.0 |
| 1991 | 0.0 | 1.0 | 0.0 | 0.0 | 1.0 | 0.0 | 0.0 | 4.0 | 0.0 | 2.0 | 0.0 |
| 1990 | 0.0 | 5.0 | 0.0 | 0.0 | 6.0 | 0.0 | 0.0 | 4.0 | 0.0 | 17.0 | 0.0 |
| 1989 | 0.0 | 46.0 | 0.0 | 0.0 | 24.0 | 0.0 | 0.0 | 43.0 | 2.0 | 36.0 | 0.0 |
| 1988 | 0.0 | 13.0 | 0.0 | 0.0 | 27.0 | 0.0 | 0.0 | 29.0 | 7.0 | 39.0 | 0.0 |
| 1987 | 0.0 | 16.0 | 0.0 | 0.0 | 20.0 | 0.0 | 0.0 | 52.0 | 3.0 | 58.0 | 0.0 |
| 1986 | 0.0 | 0.0 | 0.0 | 0.0 | 1.0 | 0.0 | 0.0 | 2.0 | 0.0 | 0.0 | 0.0 |
| 1985 | 0.0 | 0.0 | 0.0 | 0.0 | 0.0 | 0.0 | 0.0 | 0.0 | 0.0 | 0.0 | 0.0 |
| 1984 | 0.0 | 0.0 | 0.0 | 0.0 | 0.0 | 0.0 | 0.0 | 0.0 | 0.0 | 0.0 | 0.0 |
| 1983 | 0.0 | 0.0 | 0.0 | 0.0 | 0.0 | 0.0 | 0.0 | 0.0 | 0.0 | 0.0 | 0.0 |
| 1982 | 0.0 | 0.0 | 0.0 | 0.0 | 0.0 | 0.0 | 0.0 | 0.0 | 0.0 | 0.0 | 0.0 |
Distribution map
Distribution - 2017
This map shows the observed distribution of the Common Starling for 2017.
The red circles are the grid cells where Common Starling have been reported.
The transparency of the red circles indicate how many surveys sheets were submitted for that grid cell; the darker the red the more reliable the data. Of the 315 grid cells with reports, 83 had only one sheet; an example is grid number B1.
The size of the circle represents the reporting rate. The maximum reporting rate for Common Starling was 100.0% (eg grid number B1) and the minimum was 0.9% (eg grid number Q16). 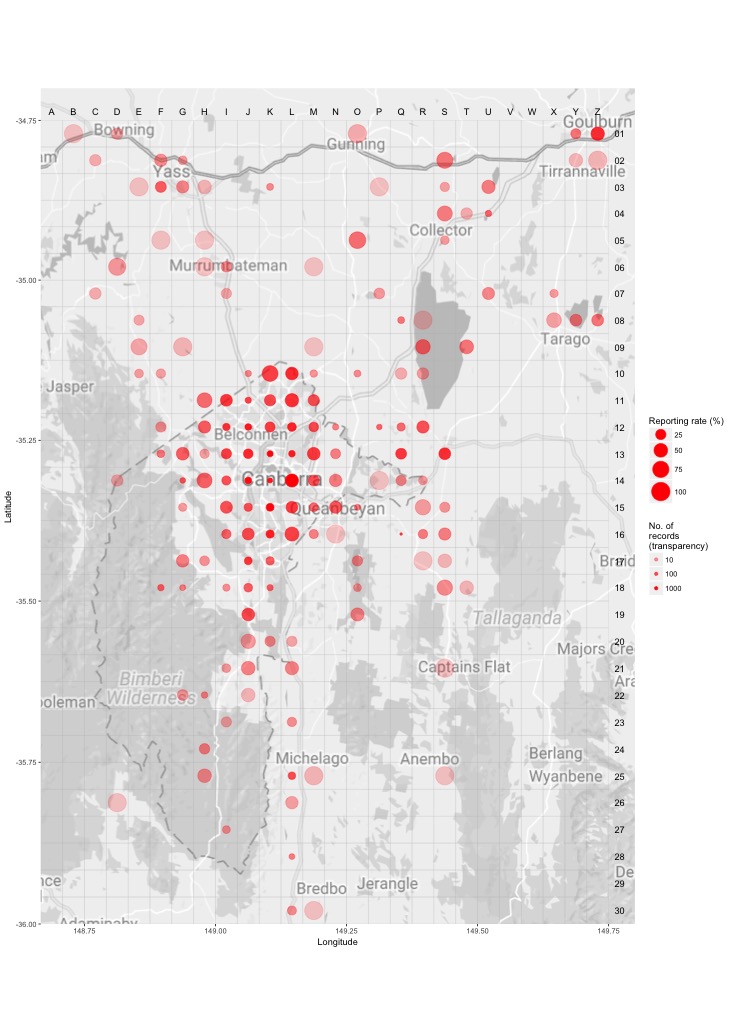
Distribution - all years
This map shows the observed distribution of the Common Starling for all years.
The red circles are the grid cells where Common Starling have been reported.
The transparency of the red circles indicate how many surveys sheets were submitted for that grid cell; the darker the red the more reliable the data. Of the 703 grid cells with reports, 55 had only one sheet; an example is grid number A12.
The size of the circle represents the reporting rate. The maximum reporting rate for Common Starling was 100.0% (eg grid number A12) and the minimum was 0.6% (eg grid number Q21). 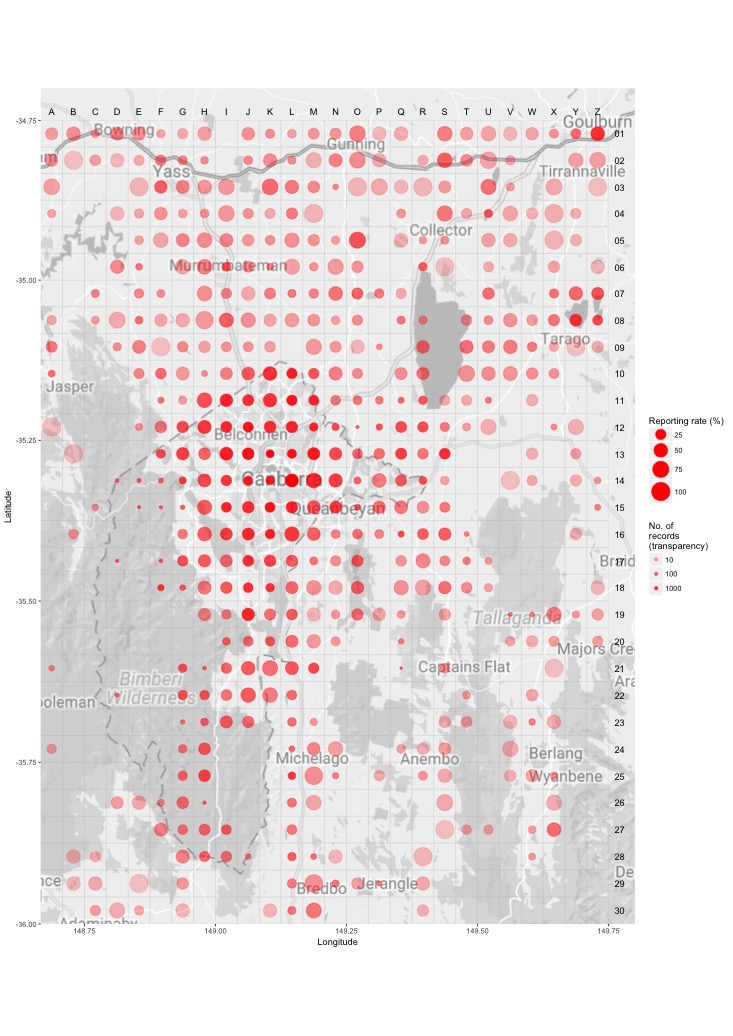
Breeding map
Breeding - 2017
This map shows the breeding distribution of the Common Starling for 2017.
The red circles are the grid cells where breeding activity for Common Starling have been reported.
The size of the circle represents the number of reports. 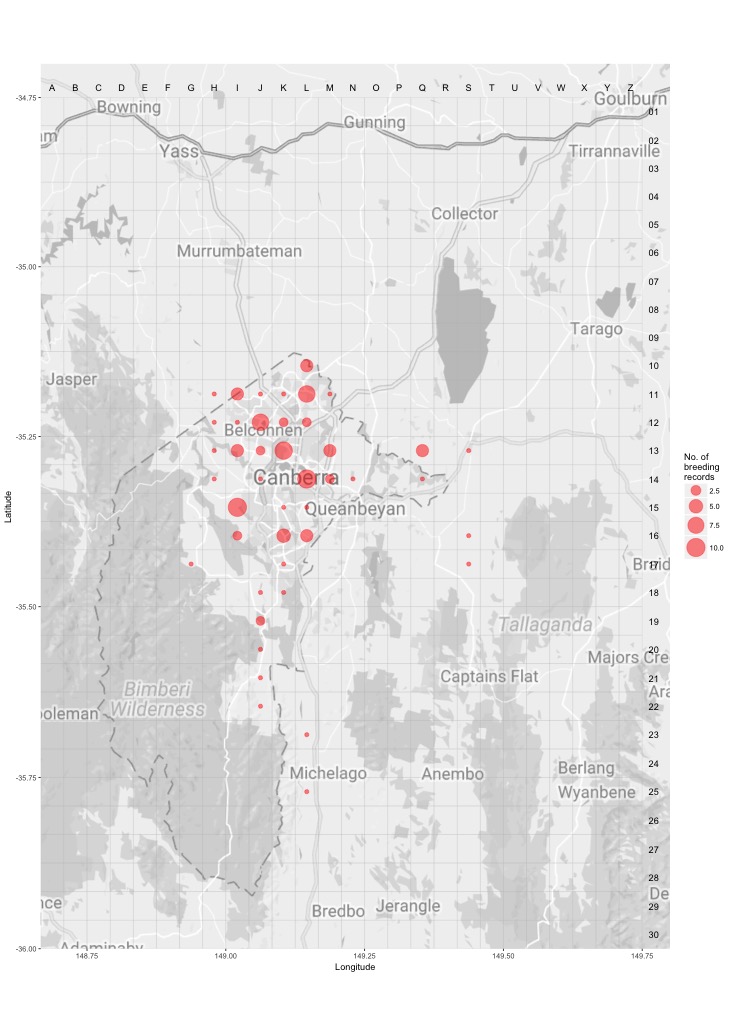
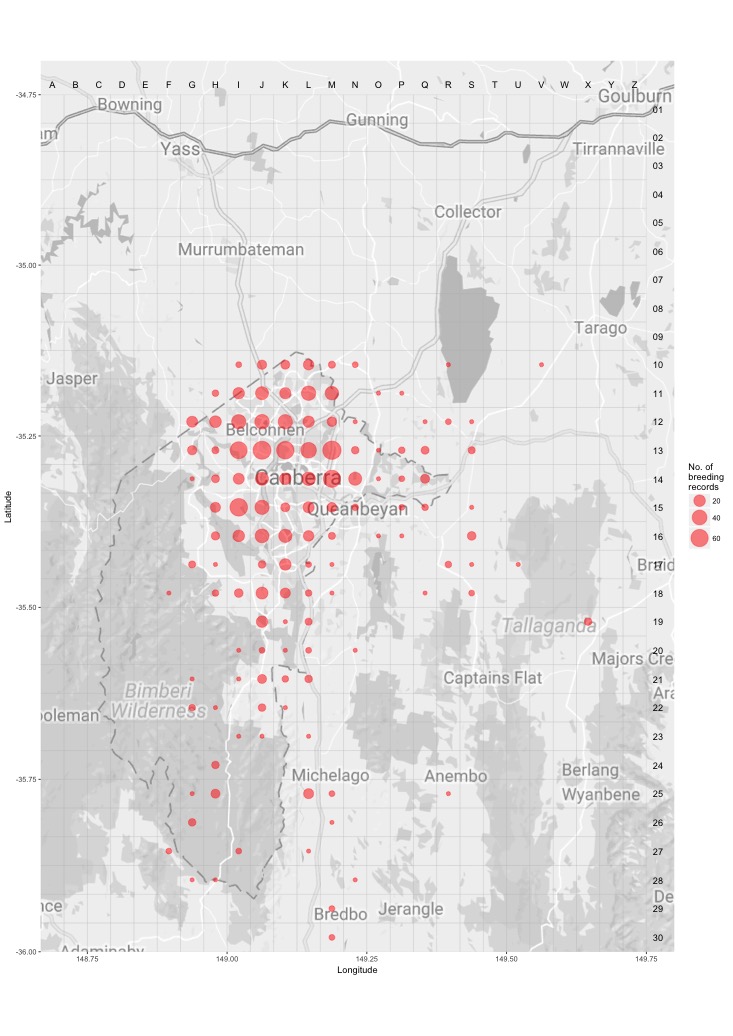
Breeding - all years
This map shows the breeding distribution of the Common Starling for all years.
The red circles are the grid cells where breeding activity for Common Starling have been reported.
The size of the circle represents the number of reports.